> ## Documentation Index
> Fetch the complete documentation index at: https://aisa.one/docs/llms.txt
> Use this file to discover all available pages before exploring further.
# Usage Logs – Track API Requests, Tokens & Billing
 The Usage Logs page provides a complete history of activity associated with your account. It records API requests, token consumption, billing details, and important system-level actions, allowing you to monitor usage, verify costs, and audit account events in one place.
This page is useful for:
* Tracking API consumption and spend
* Reviewing token usage per request
* Monitoring request performance
* Auditing activity across groups or API keys
* Investigating unexpected charges or system actions
## What Is Recorded
The Usage Logs include both API activity and key platform events.
### API Requests
All requests made through:
* API keys
* Playground
* LLM inference APIs
* Per-call APIs (Search, Financial, YouTube, Scholar, Twitter, and others)
For each request, the log captures usage, performance, and billing information.
### System & Account Events
Important account-level actions are also recorded. For example:
* Enabling two-factor authentication
* Security-related configuration changes
These entries appear as system events and are included for auditing purposes. They typically do not incur usage charges.
## Overview Metrics
At the top of the page, summary metrics are displayed for the selected time range.
**Used Quota**\
Shows the total quota consumed during the selected period.
**RPM (Requests per Minute)**\
Indicates the rate of incoming requests.
**TPM (Tokens per Minute)**\
Indicates the rate of token consumption.
These metrics help identify traffic spikes and overall usage patterns.
## Filtering and Search
Usage logs can be filtered to narrow down results.
Available filters include:
* **Date and time range**
* **Group**
* **Token Name**
* **Model Name**
Click **Query** to apply filters and **Reset** to clear them.
Column visibility can be adjusted using **Column settings**.
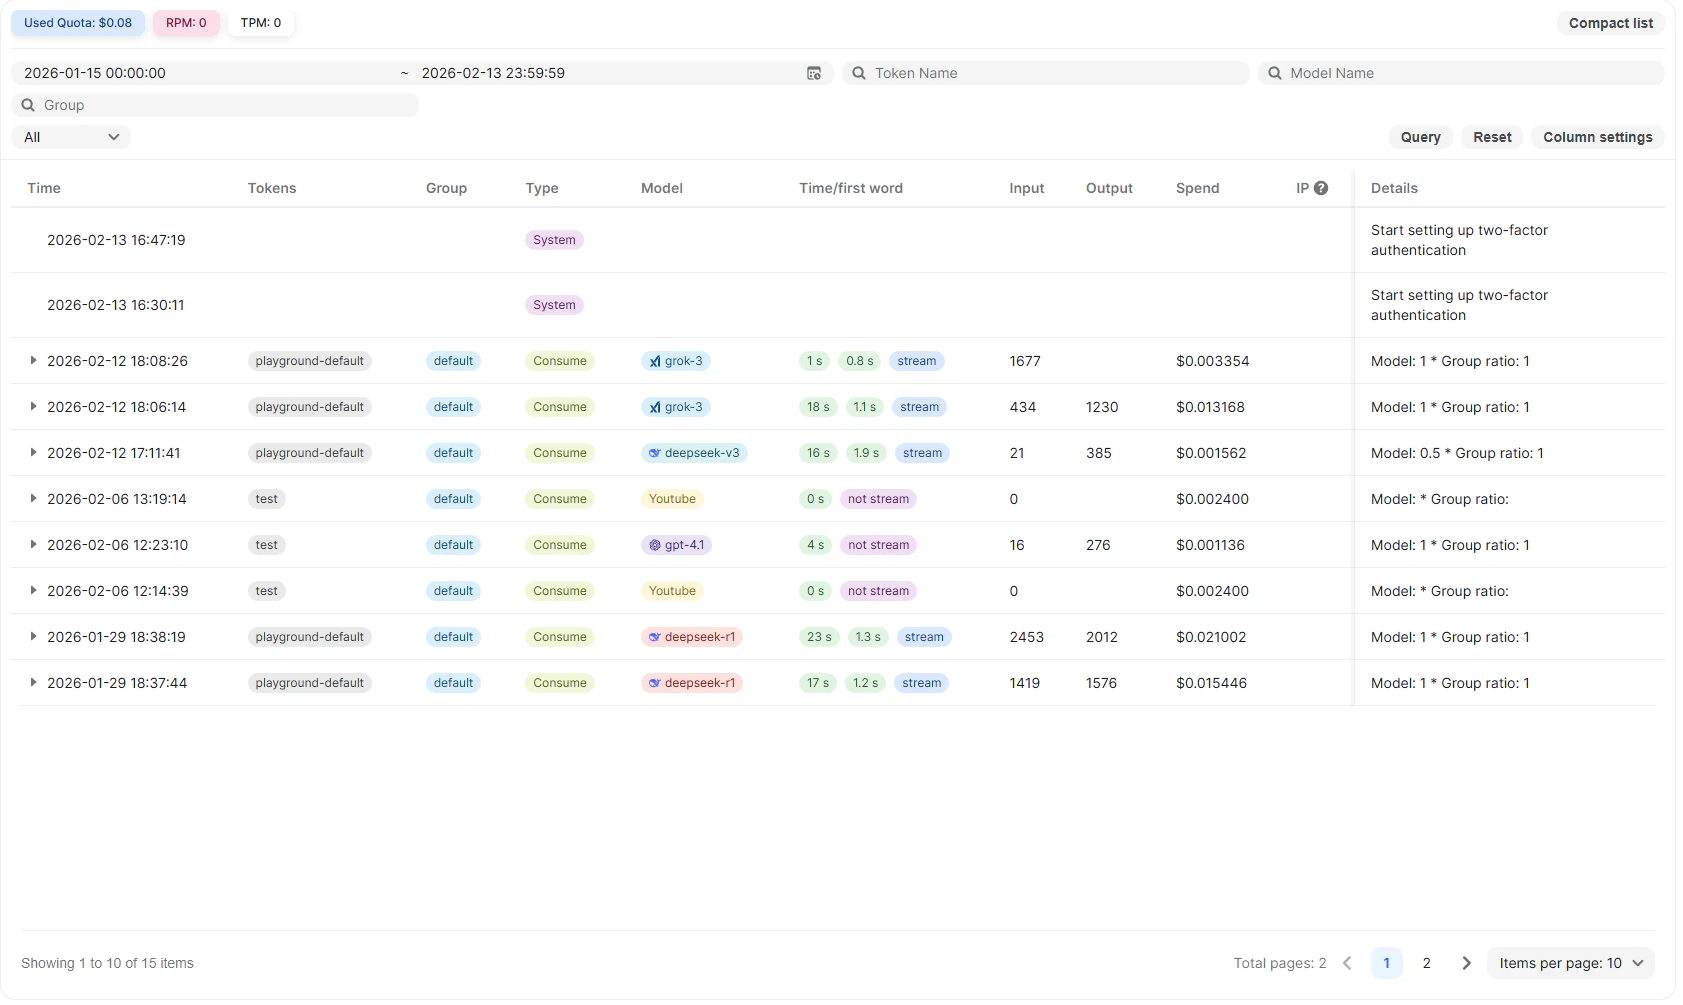
## Log Table Columns
Each row in the table represents a single event, either an API request or a system action.
**Time**
The timestamp when the event occurred.
**Tokens**
The API key used for the request. This field may be empty for system events.
**Group**
The workspace group associated with the API key.
### Type
Indicates the request type.
For example:
* ***Consume*** – A standard API request consuming tokens
* ***System*** – an account or platform-level action
**Model**
The model used to process the request (for LLM calls).
**Time / First Word**
Performance details for supported API requests, including:
* Total request duration
* Time to first response token
* Whether the response was streamed
**Input / Output**
Number of input and output tokens consumed (for LLM requests).
**Spend**
The cost associated with the event:
* Token-based cost for LLM requests
* Fixed per-call cost for per-call APIs
* Typically no cost for system events
**IP**
The source IP address associated with the request, if available.
Only when the user sets IP recording, the IP recording of request and error type logs will be performed
**Details**
Additional information, such as applied pricing ratios or a description of the system event.
## Viewing Log Details
Clicking a log entry expands a detailed breakdown.
The Usage Logs page provides a complete history of activity associated with your account. It records API requests, token consumption, billing details, and important system-level actions, allowing you to monitor usage, verify costs, and audit account events in one place.
This page is useful for:
* Tracking API consumption and spend
* Reviewing token usage per request
* Monitoring request performance
* Auditing activity across groups or API keys
* Investigating unexpected charges or system actions
## What Is Recorded
The Usage Logs include both API activity and key platform events.
### API Requests
All requests made through:
* API keys
* Playground
* LLM inference APIs
* Per-call APIs (Search, Financial, YouTube, Scholar, Twitter, and others)
For each request, the log captures usage, performance, and billing information.
### System & Account Events
Important account-level actions are also recorded. For example:
* Enabling two-factor authentication
* Security-related configuration changes
These entries appear as system events and are included for auditing purposes. They typically do not incur usage charges.
## Overview Metrics
At the top of the page, summary metrics are displayed for the selected time range.
**Used Quota**\
Shows the total quota consumed during the selected period.
**RPM (Requests per Minute)**\
Indicates the rate of incoming requests.
**TPM (Tokens per Minute)**\
Indicates the rate of token consumption.
These metrics help identify traffic spikes and overall usage patterns.
## Filtering and Search
Usage logs can be filtered to narrow down results.
Available filters include:
* **Date and time range**
* **Group**
* **Token Name**
* **Model Name**
Click **Query** to apply filters and **Reset** to clear them.
Column visibility can be adjusted using **Column settings**.
## Log Table Columns
Each row in the table represents a single event, either an API request or a system action.
**Time**
The timestamp when the event occurred.
**Tokens**
The API key used for the request. This field may be empty for system events.
**Group**
The workspace group associated with the API key.
### Type
Indicates the request type.
For example:
* ***Consume*** – A standard API request consuming tokens
* ***System*** – an account or platform-level action
**Model**
The model used to process the request (for LLM calls).
**Time / First Word**
Performance details for supported API requests, including:
* Total request duration
* Time to first response token
* Whether the response was streamed
**Input / Output**
Number of input and output tokens consumed (for LLM requests).
**Spend**
The cost associated with the event:
* Token-based cost for LLM requests
* Fixed per-call cost for per-call APIs
* Typically no cost for system events
**IP**
The source IP address associated with the request, if available.
Only when the user sets IP recording, the IP recording of request and error type logs will be performed
**Details**
Additional information, such as applied pricing ratios or a description of the system event.
## Viewing Log Details
Clicking a log entry expands a detailed breakdown.
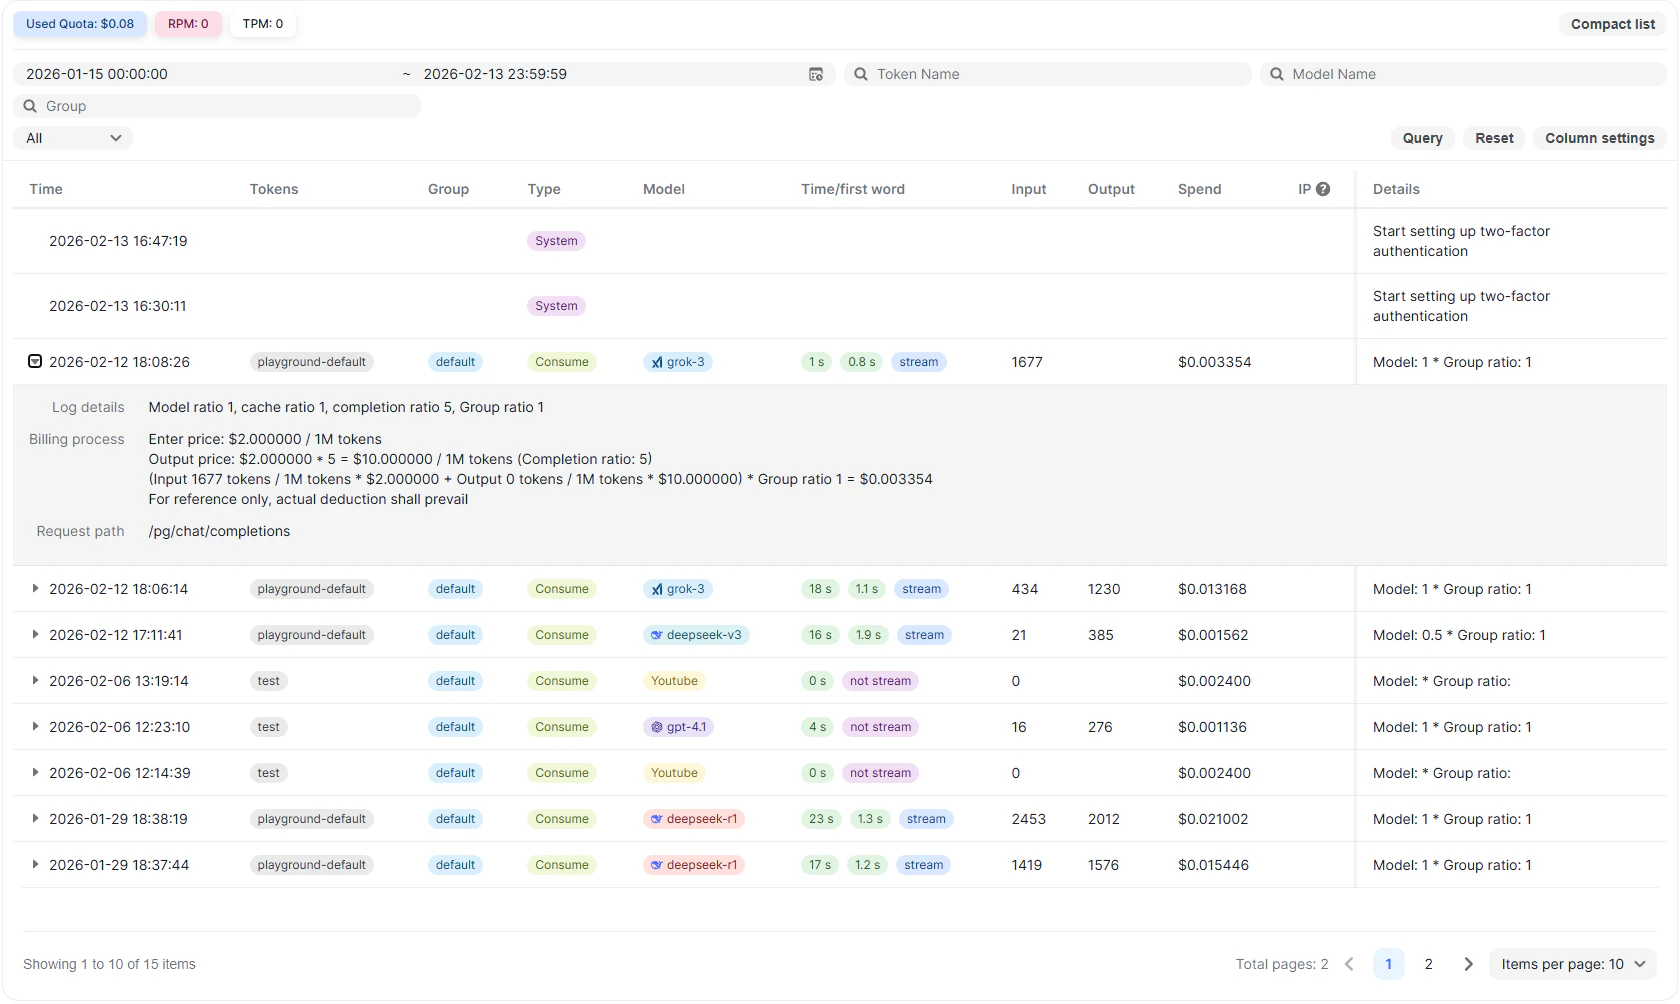 The expanded view includes:
### Model Ratio and Cache Ratio
Displays model-specific billing multipliers applied to the request.
Example fields may include:
* Model ratio
* Cache ratio
* Completion ratio
* Group ratio
### Billing Process
The billing breakdown shows how cost is calculated.
This includes:
* Input token price per 1M tokens
* Output token price per 1M tokens
* Multipliers applied
* Final calculated spend
The detailed formula is shown for transparency. Actual account deduction reflects the final calculated amount.
### Request Path
Displays the internal API route used to process the request.
Example: `/pg/chat/completions`
This helps identify which endpoint was used.
This breakdown provides full transparency into how the final cost was calculated.
For system events, the expanded view describes the action performed.
## How Billing Is Reflected
Usage costs are calculated based on:
* Token consumption (for LLM APIs)
* Fixed per-call pricing (for non-LLM APIs)
* Applicable model or group pricing rules
The Usage Logs show the calculated cost per event. The actual account balance deduction reflects the final computed amount.
## Practical Use Cases
The Usage Logs page is helpful for:
* Verifying token consumption per request
* Tracking which models are being used
* Auditing cost distribution across groups
* Debugging unexpected billing behavior
* Reviewing request latency and streaming performance
## Notes
* All Playground activity appears in Usage Logs.
* All API key requests appear in Usage Logs.
* System-level actions are recorded for audit visibility.
* Costs shown in the log are deducted from the account balance where applicable.
## Related
High-level spend and usage metrics.
Per-token rates driving the costs shown in logs.
How RPM and TPM affect your traffic.
The expanded view includes:
### Model Ratio and Cache Ratio
Displays model-specific billing multipliers applied to the request.
Example fields may include:
* Model ratio
* Cache ratio
* Completion ratio
* Group ratio
### Billing Process
The billing breakdown shows how cost is calculated.
This includes:
* Input token price per 1M tokens
* Output token price per 1M tokens
* Multipliers applied
* Final calculated spend
The detailed formula is shown for transparency. Actual account deduction reflects the final calculated amount.
### Request Path
Displays the internal API route used to process the request.
Example: `/pg/chat/completions`
This helps identify which endpoint was used.
This breakdown provides full transparency into how the final cost was calculated.
For system events, the expanded view describes the action performed.
## How Billing Is Reflected
Usage costs are calculated based on:
* Token consumption (for LLM APIs)
* Fixed per-call pricing (for non-LLM APIs)
* Applicable model or group pricing rules
The Usage Logs show the calculated cost per event. The actual account balance deduction reflects the final computed amount.
## Practical Use Cases
The Usage Logs page is helpful for:
* Verifying token consumption per request
* Tracking which models are being used
* Auditing cost distribution across groups
* Debugging unexpected billing behavior
* Reviewing request latency and streaming performance
## Notes
* All Playground activity appears in Usage Logs.
* All API key requests appear in Usage Logs.
* System-level actions are recorded for audit visibility.
* Costs shown in the log are deducted from the account balance where applicable.
## Related
High-level spend and usage metrics.
Per-token rates driving the costs shown in logs.
How RPM and TPM affect your traffic.